The Frank Value Fund Institutional Class returned 4.83% YTD compared to 0.54% for the Russell Midcap Value Index and 13.07% for the S&P 500 TR Index. Please see the end of this letter for more performance information.
Don’t Forget the Little Guy
You have likely been bombarded with fanfare from the “Magnificent 7” tech companies driving performance for the S&P 500 and NASDAQ indices this year. Lost in the excitement are small and mid-cap companies, many trading at the most attractive levels relative to large growth since 1999. The Fund’s benchmark, the Russell Midcap Value Index, has lost money over the past two years, creating opportunities for investors willing to rotate from large to small. Myopia for large tech creates opportunities on the outside, and this was another busy quarter at the Frank Value Fund. Here are a few buys:
- A profitable, recession resistant Financial Technology growing at 15%
- A profitable, recession resistant Auto Parts company with an excellent new CEO
- A profitable, recession resistant Consumer Products company with a current dividend yield of 7.5%
The requirement of “recession resistance” adds a degree of difficulty to idea generation, but I believe it is crucially important. Recession resistance means a business that is consistently profitable in all economic environments and has a strong balance sheet. Interest rates surged higher in September, tightening the vice on heavily indebted participants. Inflation may be increasing at a slower rate, but the 20% increases in housing and food costs over the past two years have paralyzed lower-income consumers. Luckily, employment is still strong (for now.) While the market presents opportunities in recession resistant companies at lower valuations than cyclical companies, the Frank Value Fund will continue to add these positions. Recession could be backdated to Q4 2023, occur in early 2024, or avoided in a miraculous soft-landing. In any scenario, the Fund’s investments in quality businesses at low valuations make sense.
Dividends and Government Bonds
As of the writing of this letter, the US 10-year government bond is yielding 4.73%. This is the highest yield in over 15 years. Contrast that to the dividend yield on the S&P 500 of 1.45% and the Russell Midcap Value paying 1.87%. As you can see in the chart below, dividend yields on the stock indices are typically in the same neighborhood as the 10-year yield, but today they aren’t even close:
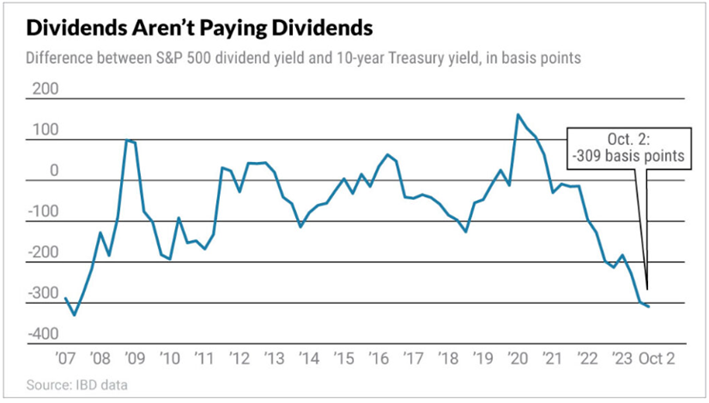
Source: https://www.investors.com/news/sp-500-dividends-are-lagging-treasury-yields-by-the-most-since-2007/
As dividends are a sizable component of long-term returns, this disparity will be a performance drag for indexers over the next several years. Happily, the Frank Value Fund is actively managed and has a plethora of high-dividend opportunities that passive investors have missed. The Fund’s estimated yield is 3.19%, the highest in its history, and with that, investors get business growth opportunities as well as potential dividend increases, something the US 10-year lacks. To reiterate our strategy, dividends are a secondary consideration to valuation and business quality, but these yields are becoming more important as fewer market participants have active mandates. Without the flows from passive strategies, ignored dividend-paying securities reward active holders with either higher yields or by attracting new investors.
Should unemployment rise and consumer spending suffer more, volatility may increase. However, in this scenario investors could switch their focus to recession-resistant companies, and the Frank Value Fund is holding some of the most attractive ideas. Remember that forced-selling frequently occurs in a recession, but stocks often trough well before unemployment peaks. Additionally, the massive gap between small value and large growth could result in compelling outperformance should investors rotate from growth to value like in 2000-2002.
Sincerely,
Brian Frank – Frank Value Fund Portfolio Manager
| Performance as of 9/30/23 | Total Return | Average Annualized Total Returns | ||||
| YTD | 1 Yr. % | 3 Yr. % | 5 Yr. % | 10 Yr. % | Since 7/21/04 % | |
| Frank Value Fund | 4.83 | 19.03 | 6.54 | 6.03 | 3.71 | 6.25* |
| Russell Midcap Value | 0.54 | 11.05 | 10.98 | 5.18 | 7.92 | 8.69 |
| S&P 500 Total Return | 13.07 | 21.62 | 10.15 | 9.92 | 11.91 | 9.46 |
* Represents an estimate based on the performance of the Fund’s Investor share class, adjusted for fees.
Performance data quoted represents past performance and does not guarantee future results. The investment return and principal value of an investment will fluctuate so that an investor’s shares, when redeemed, may be worth more or less than their original cost. Current performance may be lower or higher than the performance data quoted. You may obtain performance data current to the most recent month-end by calling the Fund at 1-888-217-5426 or visiting our website at www.frankfunds.com. Returns include reinvestment of any dividends and capital gain distributions.
Non-FDIC insured. May lose value. No bank guarantee. The Fund’s investment objectives, risks, charges and expenses must be considered carefully before investing. The prospectus contains this and other important information about the Fund, and it may be obtained by calling 1-888-217-5426. Please read it carefully before you invest or send money.
This publication does not constitute an offer or solicitation of any transaction in any securities. Any recommendation contained herein may not be suitable for all investors. Information contained in this publication has been obtained from sources we believe to be reliable, but cannot be guaranteed.
The information in this portfolio manager letter represents the opinions of the individual portfolio managers and is not intended to be a forecast of future events, a guarantee of future results or investment advice. Also, please note that any discussion of the Fund’s holdings, the Fund’s performance, and the portfolio managers’ views are as of October 5, 2023 and are subject to change without notice.