The Frank Value Fund Institutional class returned 3.62% YTD as of June 30, 2024, compared to 4.56% for the Russell Midcap Value Index and 15.29% for the S&P 500 TR Index. Since fully integrating catalyst-unlocking value into the strategy in January 2022, Frank Value Institutional class produced a Total Return of 24.58%, Russell Midcap Value Index 3.68%, and S&P 500 TR Index 19.23%. Please see the end of this letter for more performance information.
Deja Vu All Over Again
When I sat down to write this letter, my first thought was “now is exactly like Q4 2021.” The fourth quarter of 2021 turned out to be an excellent time to invest in the Frank Value Fund. Here is a chart detailing the similarities and why I think investors are set up for a repeat of 2022.
| Characteristic | Q4 2021 | Today | Comment |
| Market cap / GDP | 2.1x | 2.0x | Previous years at this valuation produced 0% ten-year returns for the S&P 500. |
| S&P 500 Dividend Yield | 1.4% | 1.3% | Far worse yield today considering interest rates are much higher. |
| New technology frenzy | Cryptocurrencies and Metaverse | Artificial Intelligence | Both trends have been taken well-beyond realistic returns from capital expenditures. |
| Frank Value Fund % Invested | 70% | 95% | Value stocks like H&R Block and Cardinal Health had positive returns in 2022 while the S&P 500 lost over 18%. Today, Frank Value has even more attractively priced securities in the portfolio with a similar setup versus the indices. |
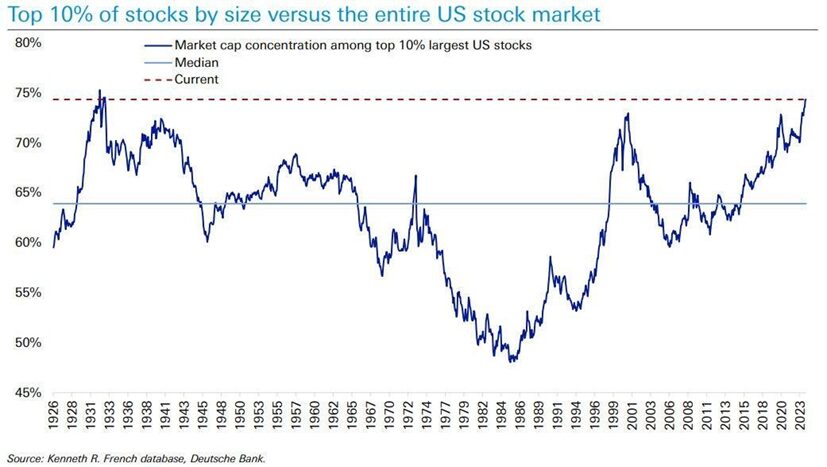
In fact, Q4 2021 might be a generous comparison to today’s market. This chart shows the environment is even more concentrated and potentially dangerous than the 1999-2000 tech bubble!
The Path Forward
The top 10% of stocks like Nvidia are driving the performance of well-known indices like the S&P 500. Everything else is getting left out. The chart above shows the last time the top 10% stocks represented over 70% of the entire US stock market capitalization was 1999. There are parallels between 1999 and today, with exciting new technology (Internet vs AI) and companies with seemingly limitless runways for growth (Cisco and Nvidia.) More important is what happened after these bubbles peaked: value stocks outperformed massively. I started my investing career at the turn of the millennium, buying boring blue-chip value companies and rejecting tech stocks at 30x forward earnings. As the NASDAQ crashed over 80% from 2000-2002, several blue chips had positive returns! The setup is similar today. Big tech is trading over 30x forward earnings, but we have invested your capital in low-valuation, high-quality stocks that reward shareholders over time.
Our portfolio has the usual power combination of high-quality and low-valuation. What differentiates us from the indices and our active competition is intentional avoidance of passive investors. The Frank Value Fund portfolio is largely invested in companies not in any index for two reasons. 1. It is difficult to find any reasonable valuations within indices. 2. We want to avoid the potential tidal shift in markets as passive investors go from net inflows to outflows.
With large passive companies’ inflows currently flatlining and unemployment increasing, passive investors could cause chaos in indices like the S&P 500 as they annually sell more securities than buying for the first time ever. When your 401(k) invests in a large-cap portfolio like the S&P 500, the passive investing companies give zero consideration to valuation. This is the primary driver of the historically high valuations in today’s market. Should workers lose their jobs and stop 401(k) contributions, or worse, need to withdraw their investments, passive investing companies must sell without any thought to meet the redemptions. Few people in the investing industry have thought about whom passive investors will sell to though! Active managers have lost market share, and anyone remaining with capital and a valuation bias will only buy at much lower prices. We have invested your money to avoid this potential selling pressure.
Conclusion
While the second quarter was frustrating for our portfolio, history as recent as 2021-2022 shows the benefit of maintaining a value discipline. Trees in 2021 did not, in fact, grow to the sky, and many growth-chasing investors hit every branch on the downward fall. The environment looks similar today and we are thankful to be full of opportunities in the fund.
Sincerely,
Brian Frank – Frank Value Fund Portfolio Manager
| Performance as of 6/30/24 | Total Return | Average Annualized Total Returns | ||||
| YTD 2024 | 2023 | 2022 | 3 Yr. % | 5 Yr. % | Since 7/21/04 % | |
| Frank Value Fund | 3.62 | 15.13 | 4.43 | 7.23 | 9.15 | 6.69* |
| Russell Midcap Value Index | 4.56 | 13.44 | -12.03 | 3.66 | 8.49 | 9.53 |
| S&P 500 Total Return Index | 15.29 | 26.29 | -18.11 | 10.00 | 15.03 | 10.48 |
* Represents an estimate based on the performance of the Fund’s Investor share class, adjusted for fees.
Performance data quoted represents past performance and does not guarantee future results. The investment return and principal value of an investment will fluctuate so that an investor’s shares, when redeemed, may be worth more or less than their original cost. Current performance may be lower or higher than the performance data quoted. You may obtain performance data current to the most recent month-end by calling the Fund at 1-888-217-5426 or visiting our website at www.frankfunds.com. Returns include reinvestment of any dividends and capital gain distributions.
Non-FDIC insured. May lose value. No bank guarantee. The Fund’s investment objectives, risks, charges and expenses must be considered carefully before investing. The prospectus contains this and other important information about the Fund, and it may be obtained by calling 1-888-217-5426. Please read it carefully before you invest or send money.
This publication does not constitute an offer or solicitation of any transaction in any securities. Any recommendation contained herein may not be suitable for all investors. Information contained in this publication has been obtained from sources we believe to be reliable, but cannot be guaranteed.
The information in this portfolio manager letter represents the opinions of the individual portfolio managers and is not intended to be a forecast of future events, a guarantee of future results or investment advice. Also, please note that any discussion of the Fund’s holdings, the Fund’s performance, and the portfolio managers’ views are as of July 9, 2024 and are subject to change without notice.